10
20
30
40
2
1
1500
1000
600
440
2000
Q
(l/min)
H
(mWS)
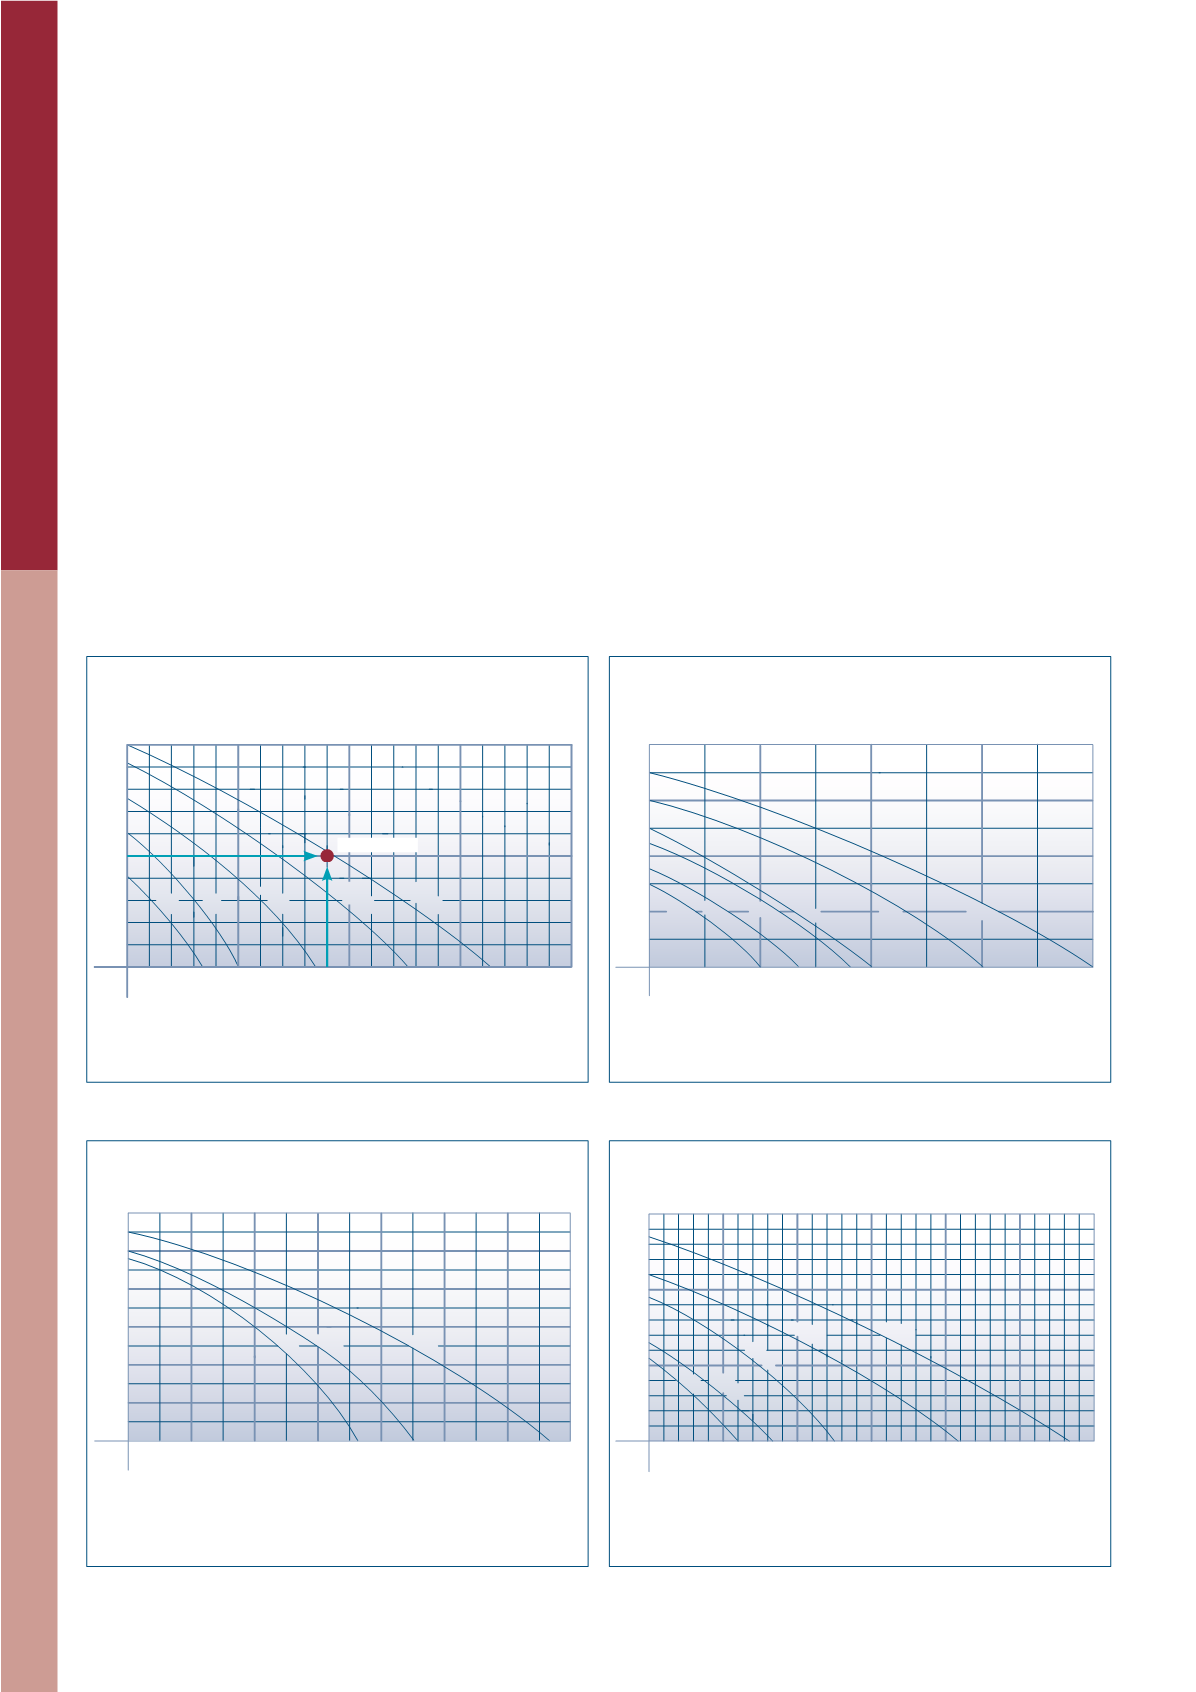
Aquarius Universal Classic 440/440i –2000
Aquarius Universal Premium 3000–12000
Q
(l/min)
50
75 100 125 150 175 200
H
(mWS)
8
6
4
2
3000
4000
5000
6000
9000
12000
Aquarius Universal Expert 21000–40000
Q
(l/min)
100
200
300
400
500
600 700
H
(mWS)
8
10
12
6
4
2
21000
27000
40000
Aquarius Fountain Set Classic 750–3500
Q
(l/min)
10
20
30
40
50
60
H
(mWS)
2
3
1
3500
2500
1500
1000
750
286
PUMP PERFORMANCE CURVES
The delivery head is specified inmwc (metre water column).
1 mwc ~ 0.1 bar
Explanation of the pump performance curve
using the Aquarius Universal 2000 as the example
At the maximum flow rate (Q) of 33 litres per minute,
measured directly on the pressure duct of the pump, the
delivery head equals 0 cm. At maximum delivery head (H)
of 200 cm the flow-rate equals 0 litres.
What is the pump performance curve used for?
The pump performance curve, also referred to as perfor-
mance data, helps you in correctly advising customers. It
shows the relationship between the flow-rate (Q) and the
delivery head (H) of a pump.
Determining the operating point (example)
The pump should displace water 1m above the water sur-
face. At the operating point, e.g. on the Aquarius Universal
2000, you can read out that approx. 18 l/min are displaced
(determined theoretically). Small hose diameter, the hose
length and built in curvature can change the value extre-
mely.
Pump performance curves – comparison
(PRO)
Page 37
Pump performance curves – comparison
(START)
Page 39
Pump performance curves – comparison
(START)
Page 33
Pump performance curves – comparison (PRO)
Page 35
Operating point
WORTH KNOWING
PUMP PERFORMANCE CURVES – COMPARISON


