P
The delivery head is specified inmwc (metre water column).
1 mwc ~ 0.1 bar
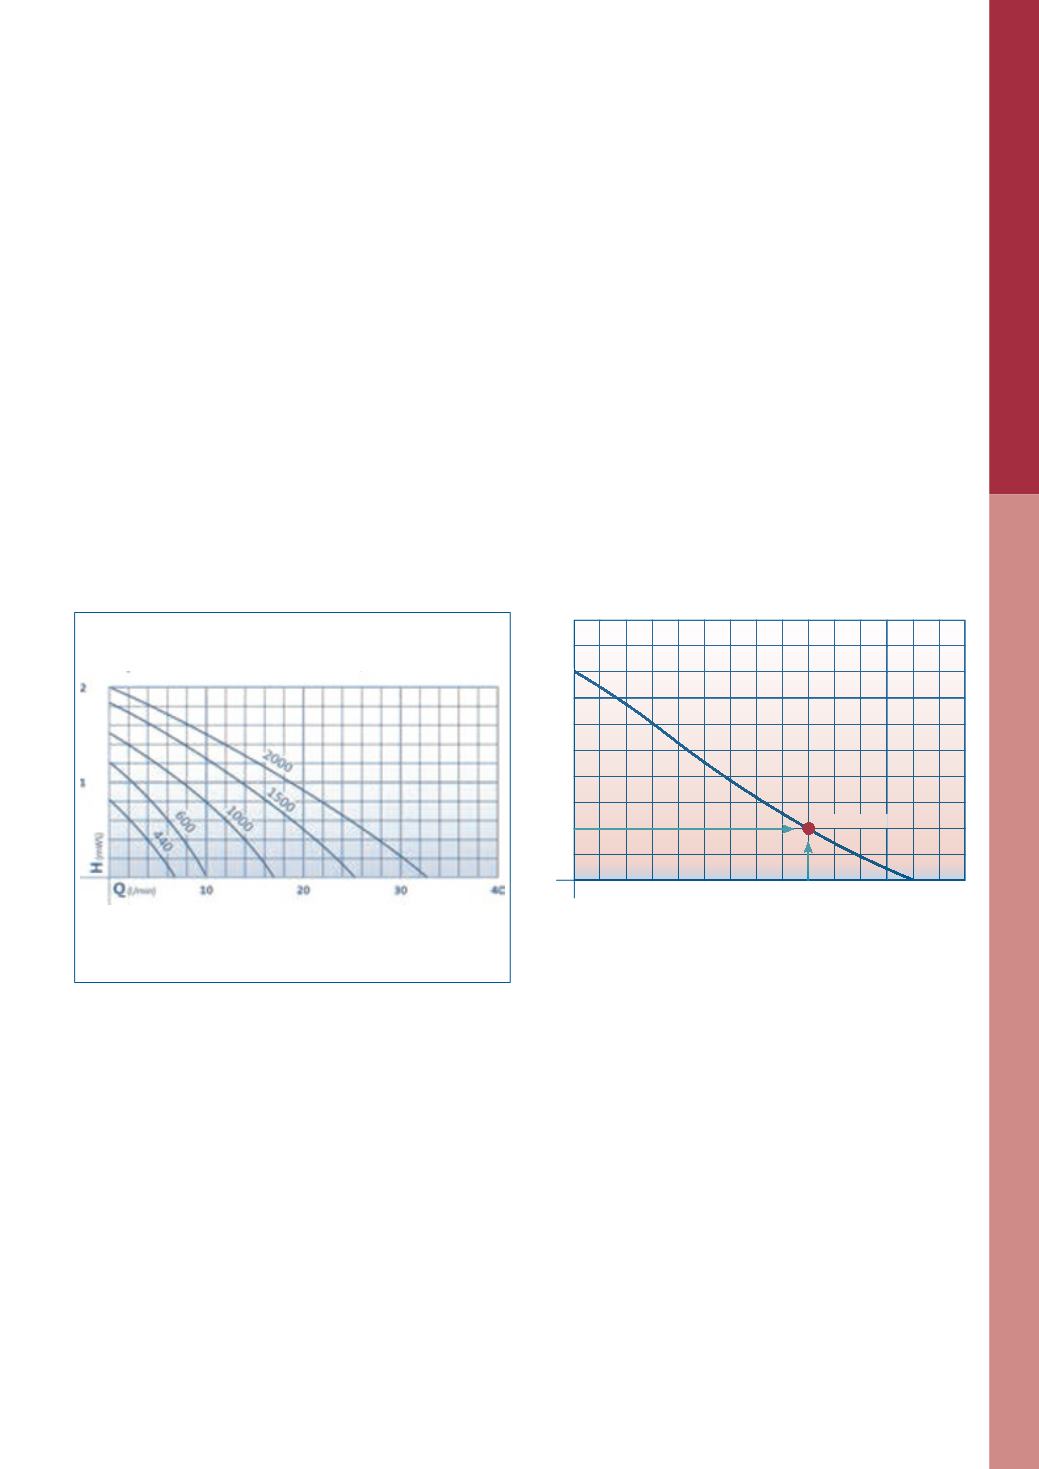
Explanation of the pump performance curve
using the Aquarius Universal 2000 as the ex-
ample
At the maximum flow rate (Q) of 33 litres per minute,
measured directly on the pressure duct of the pump, the
delivery head equals 0 cm. At maximum delivery head (H)
of 200 cm the flow-rate equals 0 litres.
What is the pump performance curve used for?
The pump performance curve, also referred to as perfor-
mance data, helps you in correctly advising customers. It
shows the relationship between the flow-rate (Q) and the
delivery head (H) of a pump.
Determining the operating point (example)
The pump should displace water 1m above the water
surface. At the operating point, e.g. on the Aquarius Uni-
versal 2000, you can read out that approx. 18 l/min are
displaced (determined theoretically). Small hose diame-
ter, the hose length and built in curvature can change the
value extremely.
Pump performance curves – comparison
(START)
Page 34
5
4
3
2
1
H (mWS)
Operating point
Q (l/min)
50
100
150
Aquarius Universal Classic 440/440i –2000
303
P –
W


